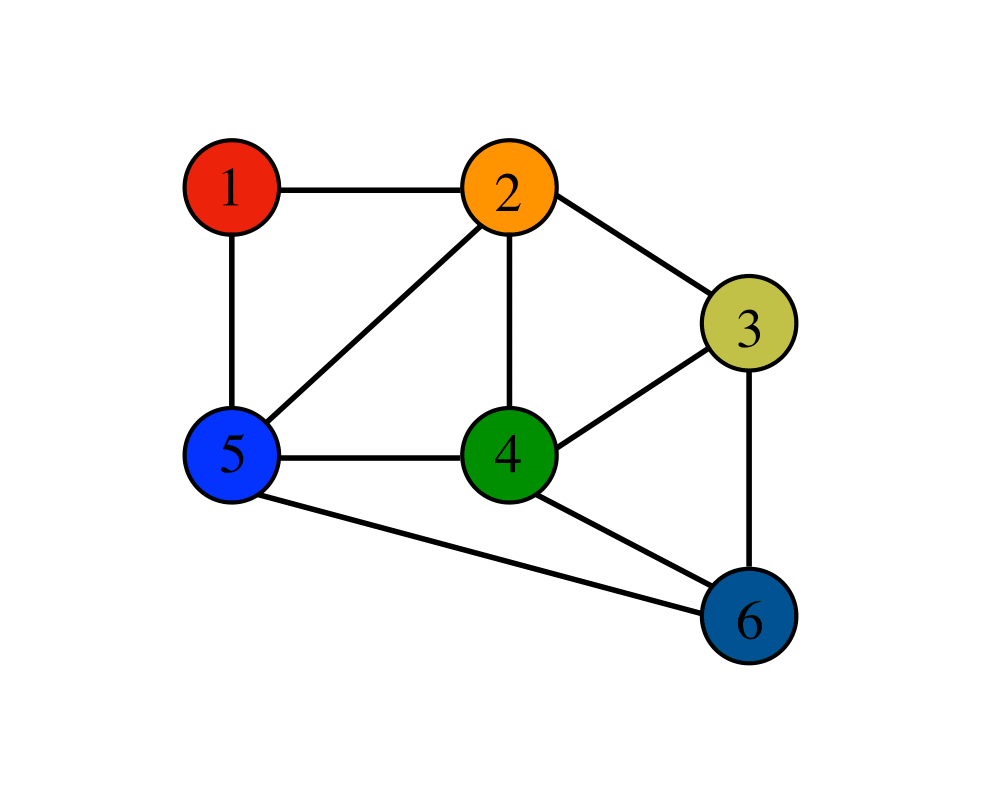
Graphs Introduction

Various application areas, including cartography, sociology, chemistry, geography, mathematics, electrical engineering, and computer science, often require representations that reflect arbitrary relationships among objects. The graph is one of the most powerful and natural ways to model such a relationship. The use of graphs has simplified and solved many concrete, practical problems, such as electrical circuits, Königsberg bridges, and Instant Insanity.
For data that contains a network or a hierarchical relationship among its elements, nonlinear data structures are used. A graph is one of the most important nonlinear data structures. A nonlinear data structure consists of elements that do not form any particular linear sequence. Each element may have more than one predecessor as well as successor.
The seven bridges of Königsberg and Instant Insanity are two classic problems which have been creatively solved. The former was successfully tackled by the great Swiss mathematician Leonhard Euler in 1736, thus initiating the field of graph theory. The latter is a puzzle featuring four cubes with each face painted in one of four different colours - red, blue, white or green - and it involves stacking them in such a way that each side shows all hues. As there are 331,776 possible combinations, working out the solution can be quite challenging; however, graphs can make the process much simpler!
